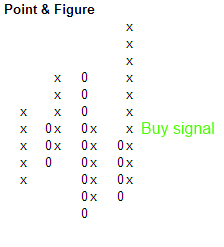
Point & Figure is a simple method of technical analysis that does not take time into account.
Point & Figure means that you draw a cross for a price rise and zero for a price fall. A cross in Point & Figure usually corresponds to an increase of 2 % and a zero usually corresponds to a decrease of 2 %. A Point & Figure
chart are created from left to right, a horizontal movement in the chart takes place only when there is a change between increase and decrease of 3 points or 6 %.
You will draw 5 crosses above each other if the share price rises by 10 % and if the share price goes up a additional 10 %, you draw 5 cross above the previous 5 crosses. If the share price then drops by 6%, you should draw three zeros to the right of the bar with crosses.
A Point & Figure chart provide information on trends and trend reversals in the share price. A buy signal in a Point & Figure chart is given when the highest level in the previous bar is passed or when a downtrend line is broken. A sell signal in a Point & Figure chart is given when the lowest level in the previous bar is crossed or when an uptrend line is broken.