The PE-ratio is a popular ratio among stock investors because it can be used to compare the valuation of different shares. The PE-ratio indicates the number of years it takes for an investment to pay back, assuming a constant profit per share.
The PE-ratio has a limitation in that it does not take into consideration
the projected growth in earnings. Comparisons on the basis of the PE-ratio can be misleading in that the growth companies is considered to be highly overvalued and non-growth companies are considered as undervalued. The solution to this problem is the PFE-ratio which takes forecasted future profits into account.
The calculation of the PFE-ratio is not as simple as calculating the PE-ratio but with access to Excel and its look up functions, this process can be automated. The PFE-ratio shows how many years it will take for an investment to pay back when you take growth in earnings into account.
Many stock investors want good ratios to compare different stocks and find cheap stocks for which a more detailed share valuation can be made.
The PFE-ratio is based on the traditional Payback-method where you want to know how long it will take for an investment to pay back. With the PFE-ratio you can quickly and easily compare the valuation between growth companies and companies with less growth.
Below is a sample calculation of PFE, the top share have a market price of 186.5 and the other share have a market price of 496.5.
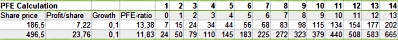
The profits will grow by Growth and are accumulated over the years. In the first line, we look up the value 186.5 and then end up in 13 years where a cumulative gain
of 177 per share has been achieved, 186.5 is higher than 177 why we calculate the distance between 186.5 and 177 and set this in relation to the
difference between the years of 14 and 13, 202-177, and get a PFE of 13.38 (13 + (186,5-177)/(202-177)). The PE-ratio had been 25.83 for the first share, but because of a profit growth of 10 % per year the time to pay back the equity investment has been reduced. The calculation of PFE is done automatically in our Excel file based on earnings per share and growth.
The PAE10-ratio is an extension of the PFE-ratio, it is calculated as a ratio between the share price today and accumulated profits during 10 years, where growth in earnings has been taken into account. The PAE10-ratio shows what you pay for a share in relation to ten years of accumulated profits. A further improvement to the PAE10-ratio is to discount future earnings with a discount rate. P/AE10D refers to the ratio between the share price today and the discounted cumulative earnings over a period of 10 years.
Growth should be estimated as the geometric profit growth over a business cycle, the cycle includes a phase of economic boom and a phase of recession and lasts between 5 to 10 years.
The best estimate of earnings growth can be obtained from information about specific business goals. Earnings per share can change on a quarterly basis and shall relate to earnings per share on an annualized basis.
Another key indicator that take earnings growth into account is PEG, PEG is calculated as the ratio between the PE-ratio and profit growth. The weakness of PEG is that it is difficult to interpret.
PFE-ratio = share price / future earnings
PAE10 = share price / earnings accumulated over 10 years
PAE10D = share price / discounted earnings accumulated over 10 years